Purchase frequency is one of the simplest measures in retail and one of the most revealing. How often a household buys a category, and how that rhythm changes, says a great deal about its budget, its confidence and its habits. It also shapes how retailers plan stock, formats and promotions. This piece sets out how frequency works across categories, and how to read the signal when it shifts.
Every category has its own rhythm
Categories fall into broad groups by how often they are bought.
- Daily or near-daily: milk, bread, fresh vegetables and some snacks, driven by perishability and proximity.
- Weekly to monthly: staples such as rice, atta, pulses and cooking oil, along with personal care and household cleaning, which follow consumption rates, pack sizes and pay cycles.
- Occasional: apparel, footwear, small appliances and home goods, which are discretionary and often tied to festivals, weddings or life events.
- Infrequent: large appliances, electronics and furniture, bought once in several years.
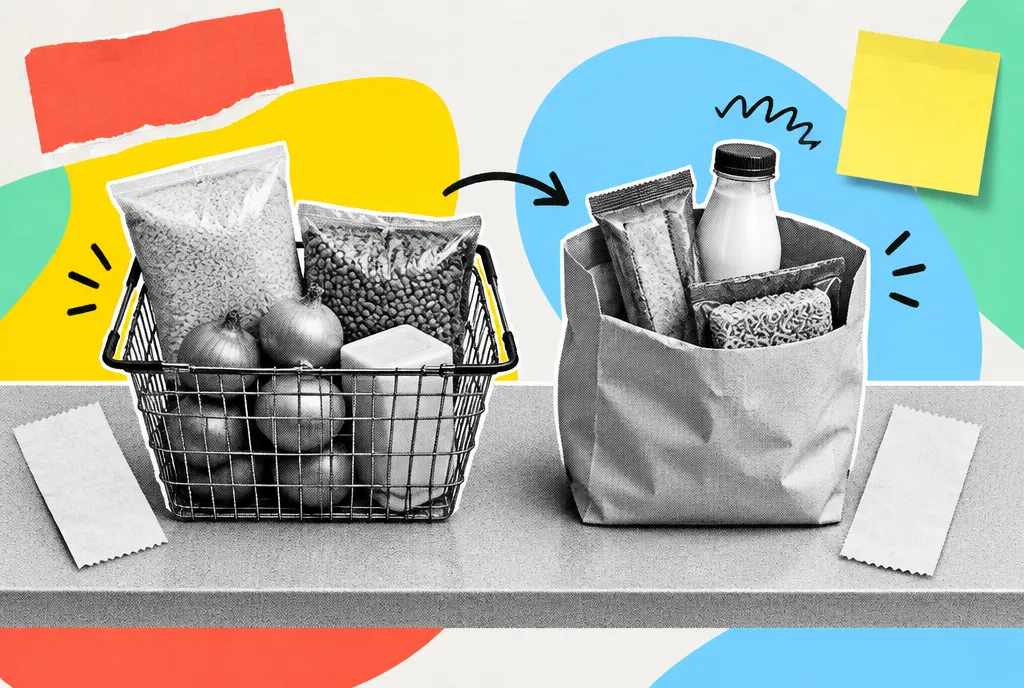
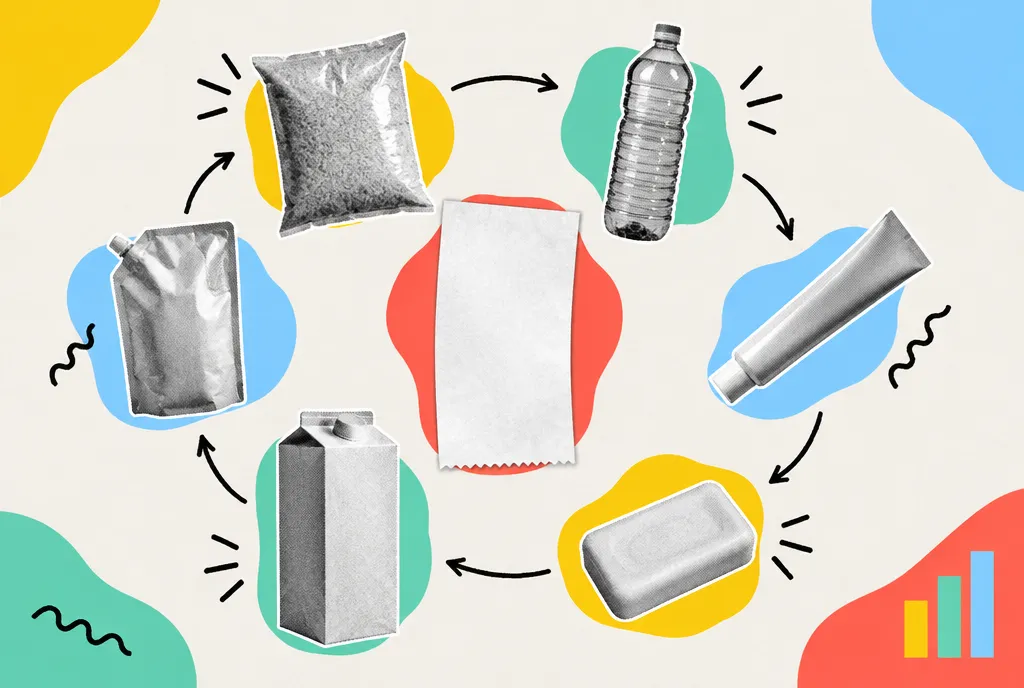
For consumables, the replenishment cycle depends on consumption rate and pack size. A household that buys a smaller pack returns sooner, which is one reason sachets and small packs can raise purchase frequency without changing total consumption.
What changes in purchase frequency can signal
Shifts in frequency are often early signs of wider change, but they need careful reading.
Rising frequency with smaller baskets in staples can indicate cash-flow pressure, with households buying what they can afford this week rather than stocking up. It can also reflect convenience, as quick commerce makes small, frequent orders easy. The same pattern can mean opposite things.
Falling frequency in discretionary categories, such as apparel or eating out, often signals caution. It may also reflect a move to fewer, larger purchases timed to sale events.
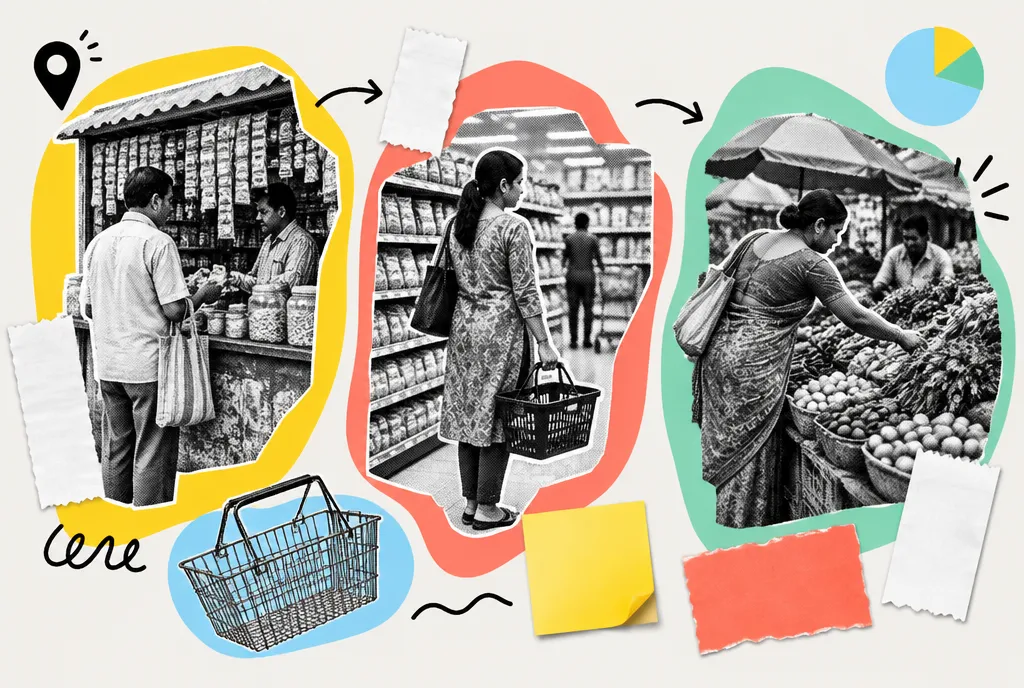
Differences across markets add another layer. Seasonal incomes, festival calendars and access to modern retail all shape when and how often households buy.
Reading the data carefully
Useful sources include household consumer panels, retailers' loyalty and transaction data, distributor shipments and quick commerce order data. Each measures something different. Retailer data captures only purchases made with that retailer. Shipment data shows stock moving into the trade, which can diverge from what consumers buy. Panel data captures household behaviour across channels but depends on sample design and accurate recording.
Any chart of purchase frequency should state its definitions: what counts as a purchase occasion, which households are included, over what period and from which channels. Without that, comparisons between sources mislead.
The signal to watch is divergence between categories. When households hold their staple routines steady but lengthen the gaps between discretionary purchases, budgets are under pressure. Retailers that track this across categories can adjust ranges and promotions before the slowdown reaches their own sales figures.
Questions this story answers
What does rising purchase frequency in staples mean?
Rising frequency with smaller baskets can indicate cash-flow pressure, with households buying what they can afford this week rather than stocking up. It can also reflect convenience, as quick commerce makes small, frequent orders easy. The same pattern can mean opposite things.
Which data sources measure purchase frequency?
Household consumer panels, retailers' loyalty and transaction data, distributor shipments and quick commerce order data. Retailer data covers only that retailer, shipments show stock moving into the trade, and panels depend on sample design and accurate recording.
How can retailers spot a slowdown early from frequency?
Watch divergence between categories. When households hold staple routines steady but lengthen the gaps between discretionary purchases, budgets are under pressure. Tracking this across categories lets retailers adjust ranges and promotions before the slowdown reaches their sales.