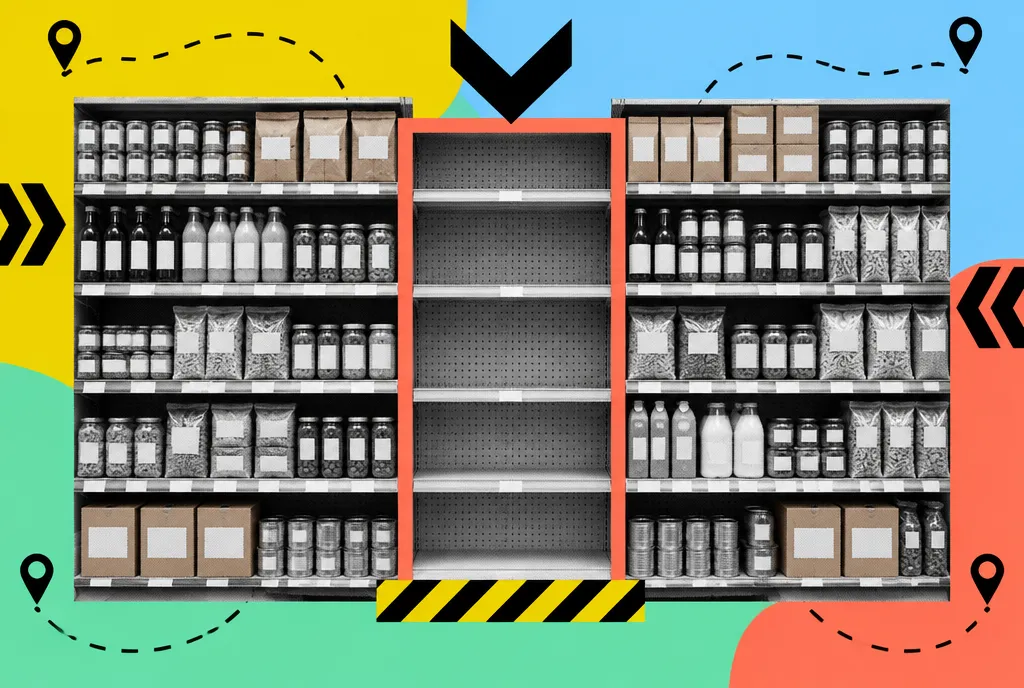
An empty shelf is the most visible failure in retail operations. It is also one of the most underestimated. The obvious loss is a sale that did not happen. The less obvious losses sit with the shopper's next decision, the supplier relationship and the store's reputation for reliability.
What a shopper does next
When a product is missing, the shopper has a handful of options, and each carries a different cost:
- Substitute another size or variant of the same brand. The retailer may keep the sale, sometimes at a different margin.
- Switch brands. The store keeps the sale, but the supplier loses it, which matters in negotiations over trade terms and promotions.
- Delay the purchase to a later visit. The sale may return, or it may not.
- Buy elsewhere, at a kirana store, a competing chain or a quick commerce app. This is the most damaging outcome, because the shopper may also move the rest of the basket.
- Drop the purchase entirely.
Behaviour varies by category. Shoppers are more willing to switch brands in commoditised staples and far less willing in categories tied to habit or trust, such as baby care, personal care and medicines. Repeated stock-outs in those categories can push a shopper to change stores altogether.
Why shelves go empty
Stock-outs rarely have a single cause. Common sources include forecasting errors, late or short supplier deliveries, delays between the backroom and the shelf, inaccurate system stock records and planograms that give fast sellers too little space. A store can hold the product in the backroom while the shelf stays empty, a failure of in-store execution rather than supply.
Phantom inventory is a particular problem. When the system believes stock exists that is actually missing, damaged or misplaced, automatic replenishment does not trigger. The gap can persist for days until someone notices.
How to measure the cost of an empty shelf
On-shelf availability is the core metric, ideally measured by physical checks or shelf images rather than inferred from system stock. Retailers can estimate lost sales by comparing a product's sales during out-of-stock periods with its normal rate, adjusted for day and season. Substitution data from baskets helps show how much demand moved to other products. Combining these gives a clearer view than any single number.
Evidence on the full cost needs care. Estimates based on store averages can hide large differences between categories and locations, and shopper surveys about switching often differ from what shoppers actually do.
Holding more safety stock reduces stock-outs but ties up working capital and space, and raises expiry risk in perishables. The aim is to find where availability matters most and protect those lines first.
The decision that matters is prioritisation. Retailers that identify the products whose absence sends shoppers elsewhere, and guard those relentlessly, recover more than those chasing perfect availability across every line.
Questions this story answers
What do shoppers do when a product is out of stock?
They may substitute another size or variant, switch brands, delay the purchase, buy elsewhere at a kirana store, competing chain or quick commerce app, or drop the purchase. Buying elsewhere is most damaging because the rest of the basket may move too.
What causes stock-outs in retail stores?
Common causes include forecasting errors, late or short supplier deliveries, delays between backroom and shelf, inaccurate system stock records and planograms that give fast sellers too little space. Phantom inventory can stop automatic replenishment for days.
How do retailers measure the cost of stock-outs?
On-shelf availability is the core metric, ideally checked physically or with shelf images. Lost sales can be estimated by comparing out-of-stock sales with the normal rate, adjusted for day and season, while basket substitution data shows where demand moved.